This page is solely dedicated to one of the best tools in the world for ESX; esxtop.
Intro
I am a huge fan of esxtop! I read a couple of pages of the
esxtop bible every day before I go to bed. Something I however am always struggling with is the “thresholds” of specific metrics. I fully understand that it is not black/white, performance is the perception of a user in the end.
There must be a certain threshold however. For instance it must be safe to say that when %RDY constantly exceeds the value of 20 it is very likely that the VM responds sluggish. I want to use this article to “define” these thresholds, but I need your help. There are many people reading these articles, together we must know at least a dozen metrics lets collect and document them with possible causes if known.
Please keep in mind that these should only be used as a guideline when doing performance troubleshooting! Also be aware that some metrics are not part of the default view. You can add fields to an esxtop view by clicking “f” on followed by the corresponding character.
I used VMworld presentations, VMware whitepapers, VMware documentation, VMTN Topics and of course my own experience as a source and these are the metrics and thresholds I came up with so far. Please comment and help build the main source for esxtop thresholds.
Metrics and Thresholds
| Display | Metric | Threshold | Explanation |
| CPU | %RDY | 10 | Overprovisioning of vCPUs, excessive usage of vSMP or a limit(check %MLMTD) has been set. See Jason’s explanation for vSMP VMs |
| CPU | %CSTP | 3 | Excessive usage of vSMP. Decrease amount of vCPUs for this particular VM. This should lead to increased scheduling opportunities. |
| CPU | %SYS | 20 | The percentage of time spent by system services on behalf of the world. Most likely caused by high IO VM. Check other metrics and VM for possible root cause |
| CPU | %MLMTD | 0 | The percentage of time the vCPU was ready to run but deliberately wasn’t scheduled because that would violate the “CPU limit” settings. If larger than 0 the world is being throttled due to the limit on CPU. |
| CPU | %SWPWT | 5 | VM waiting on swapped pages to be read from disk. Possible cause: Memory overcommitment. |
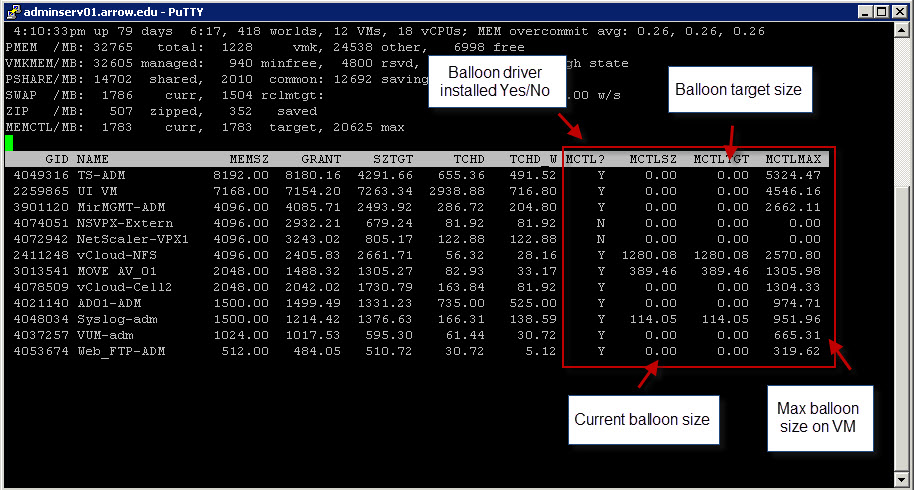
| MEM | MCTLSZ | 1 | If larger than 0 host is forcing VMs to inflate balloon driver to reclaim memory as host is overcommited. |
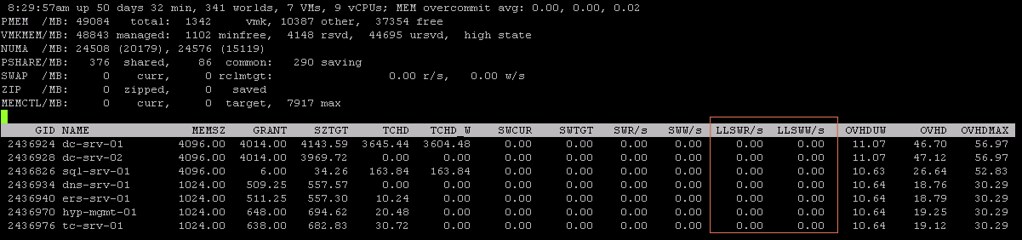
| MEM | SWCUR | 1 | If larger than 0 host has swapped memory pages in the past. Possible cause: Overcommitment. |
| MEM | SWR/s | 1 | If larger than 0 host is actively reading from swap(vswp). Possible cause: Excessive memory overcommitment. |
| MEM | SWW/s | 1 | If larger than 0 host is actively writing to swap(vswp). Possible cause: Excessive memory overcommitment. |
| MEM | CACHEUSD | 0 | If larger than 0 host has compressed memory. Possible cause: Memory overcommitment. |
| MEM | ZIP/s | 0 | If larger than 0 host is actively compressing memory. Possible cause: Memory overcommitment. |
| MEM | UNZIP/s | 0 | If larger than 0 host has accessing compressed memory. Possible cause: Previously host was overcommited on memory. |
| MEM | N%L | 80 | If less than 80 VM experiences poor NUMA locality. If a VM has a memory size greater than the amount of memory local to each processor, the ESX scheduler does not attempt to use NUMA optimizations for that VM and “remotely” uses memory via “interconnect”. Check “GST_ND(X)” to find out which NUMA nodes are used. |
| NETWORK | %DRPTX | 1 | Dropped packets transmitted, hardware overworked. Possible cause: very high network utilization |
| NETWORK | %DRPRX | 1 | Dropped packets received, hardware overworked. Possible cause: very high network utilization |
| DISK | GAVG | 25 | Look at “DAVG” and “KAVG” as the sum of both is GAVG. |
| DISK | DAVG | 25 | Disk latency most likely to be caused by array. |
| DISK | KAVG | 2 | Disk latency caused by the VMkernel, high KAVG usually means queuing. Check “QUED”. |
| DISK | QUED | 1 | Queue maxed out. Possibly queue depth set to low. Check with array vendor for optimal queue depth value. |
| DISK | ABRTS/s | 1 | Aborts issued by guest(VM) because storage is not responding. For Windows VMs this happens after 60 seconds by default. Can be caused for instance when paths failed or array is not accepting any IO for whatever reason. |
| DISK | RESETS/s | 1 | The number of commands reset per second. |
| DISK | CONS/s | 20 | SCSI Reservation Conflicts per second. If many SCSI Reservation Conflicts occur performance could be degraded due to the lock on the VMFS. |
Running esxtop
Although understanding all the metrics esxtop provides seem to be impossible using esxtop is fairly simple. When you get the hang of it you will notice yourself staring at the metrics/thresholds more often than ever. The following keys are the ones I use the most.
Open console session or ssh to ESX(i) and type:
esxtop
By default the screen will be refreshed every 5 seconds, change this by typing:
s 2
Changing views is easy type the following keys for the associated views:
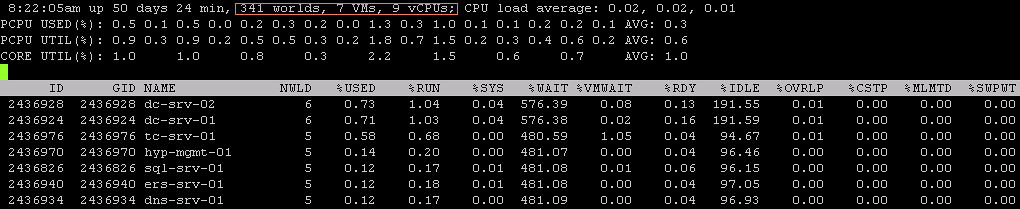
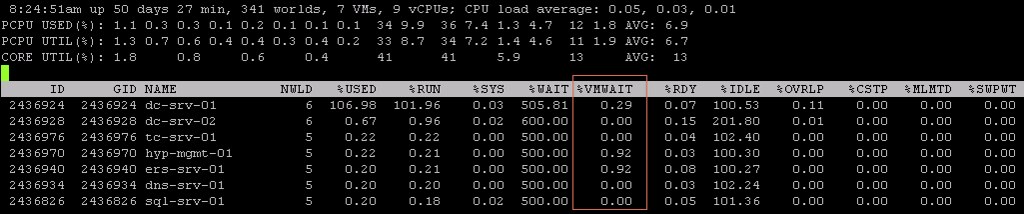
c = cpu
m = memory
n = network
i = interrupts
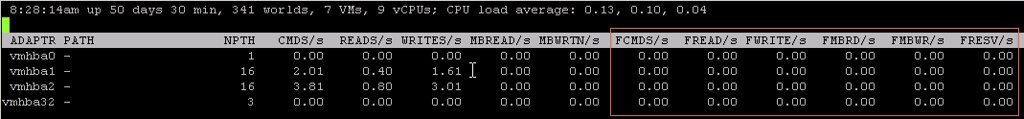
d = disk adapter
u = disk device (includes NFS as of 4.0 Update 2)
v = disk VM
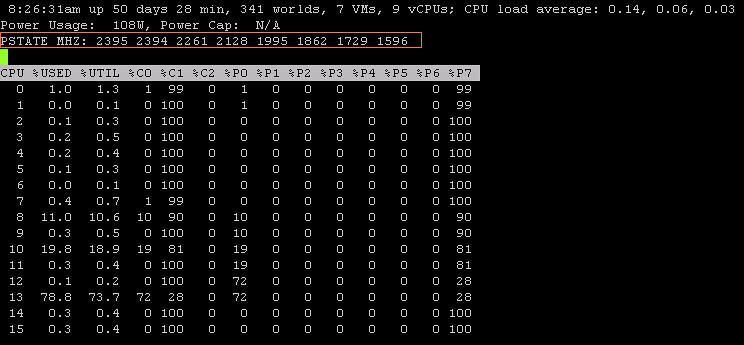
p = power states
V = only show virtual machine worlds
e = Expand/Rollup CPU statistics, show details of all worlds associated with group (GID)
k = kill world, for tech support purposes only!
l = limit display to a single group (GID), enables you to focus on one VM
# = limiting the number of entitites, for instance the top 5
2 = highlight a row, moving down
8 = highlight a row, moving up
4 = remove selected row from view
e = statistics broken down per world
6 = statistics broken down per world
Add/Remove fields:
f
Changing the order:
o
Saving all the settings you’ve changed:
W
Keep in mind that when you don’t change the file-name it will be saved and used as default settings.
Help:
?
In very large environments esxtop can high CPU utilization due to the amount of data that will need to be gathered and calculations that will need to be done. If CPU appears to highly utilized due to the amount of entities (VMs / LUNs etc) a command line option can be used which locks specific entities and keeps esxtop from gathering specific info to limit the amount of CPU power needed:
esxtop -l
More info about this command line option can be found
here.
Capturing esxtop results
First things first. Make sure you only capture relevant info. Ditch the metrics you don’t need. In other words run esxtop and remove/add(f) the fields you don’t actually need or do need! When you are finished make sure to write(W) the configuration to disk. You can either write it to the default config file(esxtop4rc) or write the configuration to a new file.
Now that you have configured esxtop as needed run it in batch mode and save the results to a .csv file:
esxtop -b -d 2 -n 100 > esxtopcapture.csv
Where “-b” stands for batch mode, “-d 2″ is a delay of 2 seconds and “-n 100″ are 100 iterations. In this specific case esxtop will log all metrics for 200 seconds. If you want to record all metrics make sure to add “-a” to your string.
Or what about directly zipping the output as well? These .csv can grow fast and by zipping it a lot of precious diskspace can be saved!
esxtop -b -a -d 2 -n 100 | gzip -9c > esxtopoutput.csv.gz
Please note that when a new VM is powered on, a VM is vMotion to the host or a new world is created it will not show up within esxtop when “-b” is used as the entities are locked! This behavior is similar to starting esxtop with “-l”.
Analyzing results
You can use multiple tools to analyze the captured data.
- VisualEsxtop
- perfmon
- excel
- esxplot
What is VisualEsxtop as it is a relatively new tool (published 1st of July 2013).
VisualEsxtop is an enhanced version of resxtop and esxtop. VisualEsxtop can connect to VMware vCenter Server or ESX hosts, and display ESX server stats with a better user interface and more advanced features.
That sounds nice right? Lets have a look how it works, this is what I did to get it up and running:
- Go to “http://labs.vmware.com/flings/visualesxtop” and click “download”
- Unzip “VisualEsxtop.zip” in to a folder you want to store the tool
- Go to the folder
- Double click “visualesxtop.bat” when running Windows (Or follow William’s tip for the Mac)
- Click “File” and “Connect to Live Server”
- Enter the “Hostname”, “Username” and “Password” and hit “Connect”
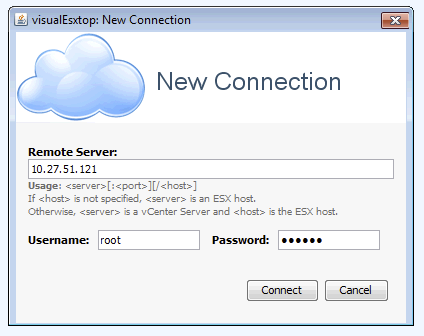
- That is it…
Now some simple tips:
- By default the refresh interval is set to 5 seconds. You can change this by hitting “Configuration” and then “Change Interval”
- You can also load Batch Output, this might come in handy when you are a consultant for instance and a customers sends you captured data, you can do this under: File -> Load Batch Output
- You can filter output, very useful if you are looking for info on a specific virtual machine / world! See the filter section.

- When you click “Charts” and double click “Object Types” you will see a list of metrics that you can create a chart with. Just unfold the ones you need and double click them to add them to the right pane
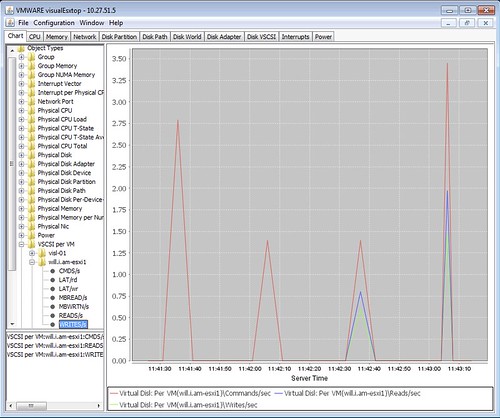
There are a bunch of other cool features in their like color-coding of important metrics for instance. Also the fact that you can show multiple windows at the same time is useful if you ask me and of course the tooltips that provide a description of the counter! If you ask me, a tool everyone should download and check out.
Let’s continue with my second favorite tool, perfmon. I’ve used perfmon(part of Windows also know as “Performance Monitor”) multiple times and it’s probably the easiest as many people are already familiar with it. You can import a CSV as follows:
- Run: perfmon
- Right click on the graph and select “Properties”.
- Select the “Source” tab.
- Select the “Log files:” radio button from the “Data source” section.
- Click the “Add” button.
- Select the CSV file created by esxtop and click “OK”.
- Click the “Apply” button.
- Optionally: reduce the range of time over which the data will be displayed by using the sliders under the “Time Range” button.
- Select the “Data” tab.
- Remove all Counters.
- Click “Add” and select appropriate counters.
- Click “OK”.
- Click “OK”.
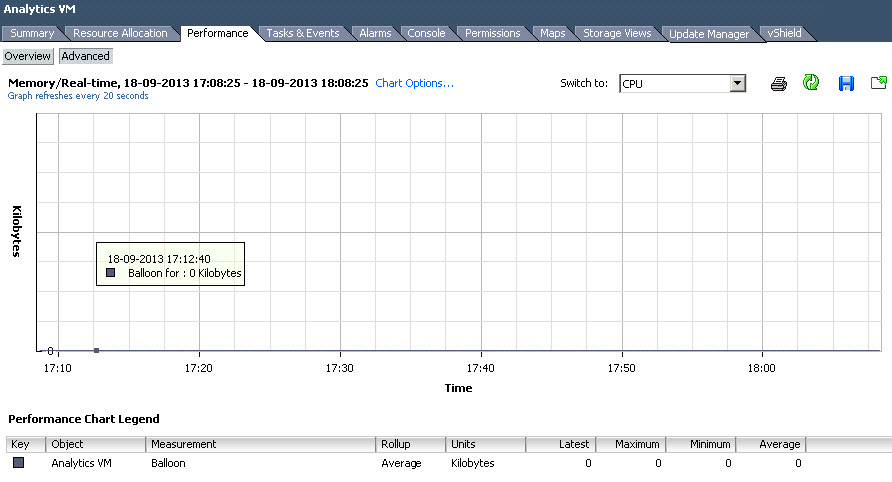
The result of the above would be:

With MS Excel it is also possible to import the data as a CSV. Keep in mind though that the amount of captured data is insane so you might want to limit it by first importing it into perfmon and then select the correct timeframe and counters and export this to a CSV. When you have done so you can import the CSV as follows:
- Run: excel
- Click on “Data”
- Click “Import External Data” and click “Import Data”
- Select “Text files” as “Files of Type”
- Select file and click “Open”
- Make sure “Delimited” is selected and click “Next”
- Deselect “Tab” and select “Comma”
- Click “Next” and “Finish”
All data should be imported and can be shaped / modelled / diagrammed as needed.
Another option is to use a tool called “
esxplot“. It hasn’t been updated in a while, and I am not sure what the state of the tool is. You can download the latest version
here though, but personally I would recommend using VisualEsxtop instead of esxplot, just because it is more recent.
- Run: esxplot
- Click File -> Import -> Dataset
- Select file and click “Open”
- Double click host name and click on metric

As you can clearly see in the screenshot above the legend(right of the graph) is too long. You can modify that as follows:
- Click on “File” -> preferences
- Select “Abbreviated legends”
- Enter appropriate value
For those using a Mac, esxplot uses specific libraries which are only available on the 32Bit version of Python. In order for esxplot to function correctly set the following environment variable:
export VERSIONER_PYTHON_PREFER_32_BIT=yes
Limiting your view
In environments with a very high consolidation ratio (high number of VMs per host) it could occur that the VM you need to have performance counters for isn’t shown on your screen. This happens purely due to the fact that height of the screen is limited in what it can display. Unfortunately there is currently no command line option for esxtop to specify specific VMs that need to be displayed. However you can export the current list of worlds and import it again to limit the amount of VMs shown.
esxtop -export-entity filename
Now you should be able to edit your file and comment out specific worlds that are not needed to be displayed.
esxtop -import-entity filename
I figured that there should be a way to get the info through the command line as and this is what I came up with. Please note that needs to be replaced with the name of the virtual machine that you need the GID for.
VMWID=`vm-support -x | grep  |awk '{gsub("wid=", "");print $1}'`
VMXCARTEL=`vsish -e cat /vm/$VMWID/vmxCartelID`
vsish -e cat /sched/memClients/$VMXCARTEL/SchedGroupID
Now you can use the outcome within esxtop to limit(l) your view to that single GID. William Lam has written an
article a couple of days after I added the GID section. The following is a lot simpler than what I came up with, thanks William!
VM_NAME=STA202G ;grep "${VM_NAME}" /proc/vmware/sched/drm-stats | awk '{print $1}'
References
The following documents / articles have been used as a reference:
Changelog
07-01-2010 | decreased %RDY from 20 to a value of 10
22-01-2010 | added CPU –> TIMER/S
22-01-2010 | added MEM –> N%L
24-01-2010 | added sections (howto)
02-02-2010 | expanded analyze section and included screenshots
10-02-2010 | decreased %CSTP from 100 to 5
10-02-2010 | decreased KAVG from 5 to 2
23-03-2010 | increase %SWPWT from 1 to 5
23-03-2010 | added “e”, “V”, “i”, “2″, “4″, “6″, “8″ in the “views” section
16-06-2010 | added “-l” functionality and stressed NFS added option
08-11-2010 | added “l”, “e”, “l”, “#”, “%SYS”, “ZIP/s”, “UNZIP/s”, “CACHEUSD”
11-11-2010 | added threshold for “CONS/s
12-03-2011 | Redid some of the formatting
25-05-2011 | added “limiting the view section”
03-01-2012 | added NUMA details
08-07-2013 | added VisualEsxtop