Sitting on my sofa this morning watching
Scrubs, I was thinking about the NUMA related considerations in vSphere –
yes, I am a nerd. I read about this for the first time back in the days
of vSphere 4.0, but it probably existed for much longer. Then it came
to my mind that since vSphere 5.0 VMware supports the configuration of
the number of sockets and cores per socket for a Virtual Machine and the
5.0 feature called vNUMA. I googled the topic for a while an found a
bit of information here and there. I figured it was time to write a
single article to completely cover the topic.

Please be aware that an additional socket in a system does NOT necessarily mean an additional NUMA node! Two or more sockets can be connected to memory with no distinction between local and remote. In this case, and in the case where we have only a single socket, we have a UMA (uniform memory access) architecture.
uma Summarizing NUMA Scheduling
UMA system: one or more sockets connected to the same RAM.
scheduling overview Summarizing NUMA Scheduling

So, we have to take a look at scheduling at two different levels to understand what is going on there. But before we go into more detail we have to take a look at a problem that might arise in NUMA systems.
P 500 Summarizing NUMA Scheduling

Those two sockets are connected to their local memory through a memory bus, but they can also access the other socket’s memory via an interconnect. AMD calls that interconnect HyperTransport which is the equivalent to Intel’s QPI (QuickPath Interconnect) technology. The names both suggest very high throughput and low latency. Well, that’s true, but compared to the local memory bus connection they are still far behind.
What does this mean to us? A process or virtual machine that was started on either of the two nodes should not be moved to a different node by the scheduler. If that happened – and it can happen if the scheduler in NUMA-unware – the process or VM would have to access its memory through the NUMA node interconnect resulting in higher memory latency. For memory intensive workloads, this can seriously influence performance of applications! This is referred to by the term “NUMA locality”.
NUMA-awareness means the scheduler is aware of the NUMA topology: the number of NUMA nodes, number of sockets per node, the number of cores per socket and the amount of memory local to a single NUMA node. The scheduler will try to avoid issues with NUMA locality. To do that, ESXi will make an initial placement decision to assign a starting VM to a NUMA node. From now on, the VM’s vCPUs are load balanced dynamically across cores on that same socket.
numa scheduling Summarizing NUMA Scheduling

In this example, VMs A and B were assigned to NUMA node 1 having to share cores on that socket. VM C is scheduled on a different node, so that VMs A and B will not have to share cores with VM C. In the case of very high load on either socket, ESXi can decide to migrate a VM from one NUMA node to another. But that’s not going to happen recklessly as the price for that is very high: To avoid NUMA locality problems after the migration, ESXi will migrate the VM’s memory image, too. That puts high load on the memory bus and the interconnect and could influence the overall performance on that host. But if perceived benefits outreach costs, that is going to happen.
In the figure above, the VMs are “small” meaning they have less vCPUs than the number of cores per NUMA node and less memory than what is local to a single NUMA node.
wide vm2 Summarizing NUMA Scheduling
Figure 5: A large VM spannung two NUMA nodes.
To avoid this, it is the administrators job to make sure every VM fits into a single NUMA node. This includes the number of vCPUs and the amount of memory allocated to this VM.
As a result, chances of remote access and high latencies are decreased. But this is not the final solution because operating systems are still unaware of what is happening down there.
In figure 5, the VM spans two NUMA nodes with 4 vCPUs on one and 2 vCPUs on the other node. The OS sees 6 single-core sockets and treats them all as scheduling targets of equal quality for any running process. But actually, scheduling a process from the very left vCPU to the very right vCPU migrates the process from one physical NUMA node to another.

This results in two lines in the VM’s .vmx configuration file:
Well, this is not the end of the story. This I read in the Resource Management Guide:
The numactl tool shows only a single NUMA node – I configured 2 virtual sockets in vSphere Client, remember? Well, sockets doesn’t necessarily mean NUMA node (see above). From the OS’s perspective, this is a UMA system with 2 sockets.
Next, I configured the VM for 2 virtual sockets, 6 cores per socket. This time, we exceed 8 vCPUs, so Linux should see a NUMA system now. And it does:
As explained above, vNUMA kicks in from 9 vCPUs. To reduce that threshold to some lower number, configure the numa.vcpu.maxPerVirtualNode advanced setting for that VM. This setting defaults to 4 (as it is per virtual node).
Configure a VM with less vCPUs than the number of physical cores per socket.
Configure a VM with less memory than what is local to a single physical NUMA node.
vSphere 4.1:
Configure a VM with more vCPUs than the number of physical cores per socket is a bit less of a problem but there is still a chance of remote accesses.
vSphere 5.0:
Configuring 8 or less vCPUs for a VM does not change much compared to vSphere 4.1.
Assigning more than 8 vCPUs to a VM spread across multiple sockets create virtual NUMA nodes inside the guest allowing for better scheduling decisions in the guest.
For every version of vSphere, please note that the whole issue of memory latency might not even apply to your VM! For VMs with low memory workloads the whole question might be irrelevant as the performance loss is so minimal.
http://www.vxpertise.net/tag/numa/
What is NUMA?
Let’s start with a quick review of NUMA. This is taken from Wikipedia:Non-Uniform Memory Access (NUMA) is a computer memory design used in multiprocessing, where the memory access time depends on the memory location relative to a processor. Under NUMA, a processor can access its own local memory faster than non-local memory, that is, memory local to another processor or memory shared between processors.This means in a physical server with two or more sockets on an Intel Nehalem or AMD Opteron platform, very often we find memory that is local to one and memory that is local to the other socket. A socket, its local memory and the bus connecting the two components is called a NUMA node. Both sockets are connected to the other sockets’ memory allowing remote access.
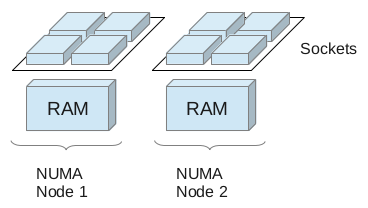
Please be aware that an additional socket in a system does NOT necessarily mean an additional NUMA node! Two or more sockets can be connected to memory with no distinction between local and remote. In this case, and in the case where we have only a single socket, we have a UMA (uniform memory access) architecture.
uma Summarizing NUMA Scheduling
UMA system: one or more sockets connected to the same RAM.
Scheduling – The Complete Picture
Whenever we virtualize complete operating systems, we get two levels of where scheduling takes place: A VM is provided with vCPUs (virtual CPUs) for execution and the hypervisor has to schedule those vCPUs accross pCPUs (physical CPUs). On top of this, the guest scheduler distributes execution time on vCPUs to processes and threads.scheduling overview Summarizing NUMA Scheduling
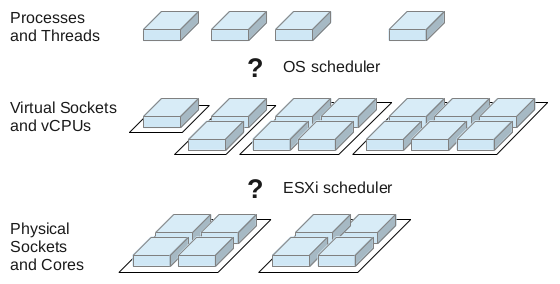
So, we have to take a look at scheduling at two different levels to understand what is going on there. But before we go into more detail we have to take a look at a problem that might arise in NUMA systems.
The Locality Problem
Each NUMA node has its own computing power (the cores on the socket) and a dedicated amount of memory assigned to that node. You can very often even see that taking a look at your mainboard. You will see two sockets and two separate groups of memory slots.P 500 Summarizing NUMA Scheduling
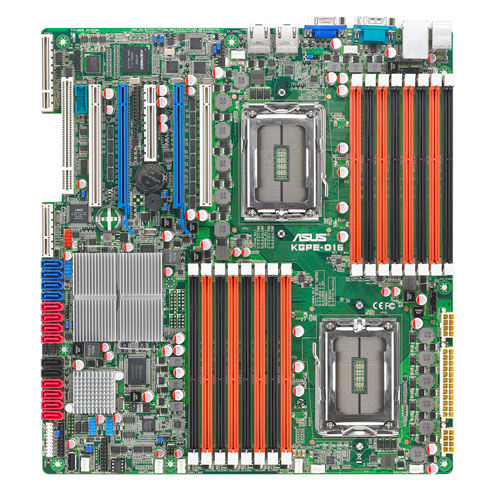
Those two sockets are connected to their local memory through a memory bus, but they can also access the other socket’s memory via an interconnect. AMD calls that interconnect HyperTransport which is the equivalent to Intel’s QPI (QuickPath Interconnect) technology. The names both suggest very high throughput and low latency. Well, that’s true, but compared to the local memory bus connection they are still far behind.
What does this mean to us? A process or virtual machine that was started on either of the two nodes should not be moved to a different node by the scheduler. If that happened – and it can happen if the scheduler in NUMA-unware – the process or VM would have to access its memory through the NUMA node interconnect resulting in higher memory latency. For memory intensive workloads, this can seriously influence performance of applications! This is referred to by the term “NUMA locality”.
Small VMs on ESXi
ESX and ESXi servers are NUMA-aware for a while now – to be exact since version 3.5.NUMA-awareness means the scheduler is aware of the NUMA topology: the number of NUMA nodes, number of sockets per node, the number of cores per socket and the amount of memory local to a single NUMA node. The scheduler will try to avoid issues with NUMA locality. To do that, ESXi will make an initial placement decision to assign a starting VM to a NUMA node. From now on, the VM’s vCPUs are load balanced dynamically across cores on that same socket.
numa scheduling Summarizing NUMA Scheduling

In this example, VMs A and B were assigned to NUMA node 1 having to share cores on that socket. VM C is scheduled on a different node, so that VMs A and B will not have to share cores with VM C. In the case of very high load on either socket, ESXi can decide to migrate a VM from one NUMA node to another. But that’s not going to happen recklessly as the price for that is very high: To avoid NUMA locality problems after the migration, ESXi will migrate the VM’s memory image, too. That puts high load on the memory bus and the interconnect and could influence the overall performance on that host. But if perceived benefits outreach costs, that is going to happen.
In the figure above, the VMs are “small” meaning they have less vCPUs than the number of cores per NUMA node and less memory than what is local to a single NUMA node.
Large VMs on ESXi prior to vSphere 4.1
Thing start to become interesting for VMs with more vCPUs than the number of cores on a single socket. The hypervisor scheduler would have to have that VM span multiple NUMA nodes. A VM like this will not be handled by the NUMA scheduler anymore – so no home node will be assigned. As a result, the VM’s vCPUs will not be restricted to one or two NUMA nodes but can be scheduled anywhere on the system. Memory will be allocated from all NUMA nodes in a round-robin fashion. Like that, memory access latencies will dramatically increase.wide vm2 Summarizing NUMA Scheduling
Figure 5: A large VM spannung two NUMA nodes.
To avoid this, it is the administrators job to make sure every VM fits into a single NUMA node. This includes the number of vCPUs and the amount of memory allocated to this VM.
Wide-VMs since vSphere 4.1
Introduced in vSphere 4.1 the concept of a “Wide-VM” addresses the issue of memory locality for virtual machines larger than a single NUMA node. The VM is split into two or more NUMA clients which are then treated as if they were separate VMs handled by theNUMA scheduler. That means, each NUMA client will be assigned its own home node and be limited to the pCPUs on that node. Memory will be allocated from the NUMA nodes the VM’s NUMA clients are assigned to. This improves the locality issue and enhances performance for Wide-VMs. A technical white paper provided by VMware goes into more detail on how big the performance impact really is.As a result, chances of remote access and high latencies are decreased. But this is not the final solution because operating systems are still unaware of what is happening down there.
Scheduling in the Guest OS
Before vSphere 5.0, the NUMA topology was unknown to the guest OS. The scheduler inside the guest OS was not aware of the number of NUMA nodes, their associated local memory or the number of cores contained by the socket. From the OS’s perspective, all available vCPUs were seen as being their own sockets, all memory can be accessed from all sockets in the same speed. Due to this unawareness, a scheduling decision made by the OS could suddenly render a well-performing process suffering from bad memory locality after is was moved from one vCPU to another.In figure 5, the VM spans two NUMA nodes with 4 vCPUs on one and 2 vCPUs on the other node. The OS sees 6 single-core sockets and treats them all as scheduling targets of equal quality for any running process. But actually, scheduling a process from the very left vCPU to the very right vCPU migrates the process from one physical NUMA node to another.
vNUMA since vSphere 5.0
vNUMA exposes the NUMA topology to the guest OS allowing for better scheduling decisions in the operating system. ESXi creates virtual sockets visible to the OS each with an equal amount of vCPUs visible as cores. Memory is evenly split accross sockets creating multiple NUMA nodes from the OS’s perspective. Using hardware version 8 for your VMs, you can use vSphere Client to configure vNUMA per VM:
This results in two lines in the VM’s .vmx configuration file:
numvcpus = "8"

cpuid.coresPerSocket = "4"
Well, this is not the end of the story. This I read in the Resource Management Guide:
If the number of cores per socket (cpuid.coresPerSocket) is greater than one, and the number of virtual cores in the virtual machine is greater than 8, the virtual NUMA node size matches the virtual socket size.The best way to understand this, is to have a look into a Linux OS and investigate the CPU from there: I configured a Debian Squeeze 64bit to have 2 virtual sockets and 2 cores per socket using vSphere Client und used the /proc/cpuinfo file and a tool called numactl to gather the following info:
root@vnumademo:~# numactl --hardware

available: 1 nodes (0-0)

node 0 cpus: 0 1 2 3

node 0 size: 1023 MB

node 0 free: 898 MB

node distances:

node   0

0:  10

root@vnumademo:~# cat /proc/cpuinfo | grep "physical id"

physical id     : 0

physical id     : 0

physical id     : 1

physical id     : 1

root@vnumademo:~#
The numactl tool shows only a single NUMA node – I configured 2 virtual sockets in vSphere Client, remember? Well, sockets doesn’t necessarily mean NUMA node (see above). From the OS’s perspective, this is a UMA system with 2 sockets.
Next, I configured the VM for 2 virtual sockets, 6 cores per socket. This time, we exceed 8 vCPUs, so Linux should see a NUMA system now. And it does:
root@vnumademo:~# numactl --hardware

available: 2 nodes (0-1)

node 0 cpus: 0 1 2 3 4 5

node 0 size: 511 MB

node 0 free: 439 MB

node 1 cpus: 6 7 8 9 10 11

node 1 size: 511 MB

node 1 free: 462 MB

node distances:

node   0   1

0:  10  20

1:  20  10

root@vnumademo:~# cat /proc/cpuinfo | grep "physical id"

physical id     : 0

physical id     : 0

physical id     : 0

physical id     : 0

physical id     : 0

physical id     : 0

physical id     : 1

physical id     : 1

physical id     : 1

physical id     : 1

physical id     : 1

physical id     : 1

root@vnumademo:~#
As explained above, vNUMA kicks in from 9 vCPUs. To reduce that threshold to some lower number, configure the numa.vcpu.maxPerVirtualNode advanced setting for that VM. This setting defaults to 4 (as it is per virtual node).
Bottom Lines for Administrators
vSphere 4.0 and before:Configure a VM with less vCPUs than the number of physical cores per socket.
Configure a VM with less memory than what is local to a single physical NUMA node.
vSphere 4.1:
Configure a VM with more vCPUs than the number of physical cores per socket is a bit less of a problem but there is still a chance of remote accesses.
vSphere 5.0:
Configuring 8 or less vCPUs for a VM does not change much compared to vSphere 4.1.
Assigning more than 8 vCPUs to a VM spread across multiple sockets create virtual NUMA nodes inside the guest allowing for better scheduling decisions in the guest.
For every version of vSphere, please note that the whole issue of memory latency might not even apply to your VM! For VMs with low memory workloads the whole question might be irrelevant as the performance loss is so minimal.
http://www.vxpertise.net/tag/numa/


